Archive: Apr 2010


How have adults and young people weathered the worldwide economic downturn? This two-minute 12-second video shows that young people have been harder hit by joblessness in almost all OECD countries:

From the OECD Factblog.

Lisa Wade, PhD is an Associate Professor at Tulane University. She is the author of American Hookup, a book about college sexual culture; a textbook about gender; and a forthcoming introductory text: Terrible Magnificent Sociology. You can follow her on Twitter and Instagram.

Asa D. sent in an animated 1958 Disney segment titled “Magic Highway USA.” The cartoon extols the virtues of the highway system of the future (the interstate highway system was authorized by President Eisenhower in 1956). Apparently it is farther into the future than 2010, as my windshield does not have a radar, and road construction around here doesn’t seem to be instantaneous:

The segment of course illustrates gender expectations of the time — dad goes off to work while mom and the kid(s) go shopping. But as Asa points out, this example of the “techno-utopianism” of the post-World War II era, with faith that modern technologies will lead to a happy future that increasingly frees us from unpleasant work, boredom, wasted time, and so on, is truly fascinating.

Providing a nice contrast to that earlier vision, Dmitriy T.M. let us know about the stop-motion short video Metropolis by Rob Carter. The entire video, which is 9 1/2 minutes long, gives an abridged history of Charlotte, North Carolina.

Here are the last 3 minutes (you can see the entire video here). In this segment, we see the unfolding of a large highway system and urban construction/destruction/reconstruction. At about a minute in, “the video continues the city development into an imagined hubristic future, of more and more skyscrapers and sports arenas and into a bleak environmental future” (quote found here):

Metropolis by Rob Carter – Last 3 minutes from Rob Carter on Vimeo.

NEW! (May ’10): Kris H. sent in another example of envisioning the future. The Futurama, an exhibit at the 1939 World’s Fair, promised a future in which interstate highways will allow people to bypass slums, relieving us of the work of fixing them (found at Neatorama):

Jose Marichal, who blogs at Thick Culture, forwarded us this compilation of Bob Barker’s infantilizing and harassing behavior on The Price is Right during the 1970s.  It’s pretty stunning:

I’d like to say that men don’t call women “girls” these days… but I’m watching Jaime Oliver’s Food Revolution.

Source: FourFour via The Daily Dish.  More examples of calling women girls, both vintage and contemporary.

Lisa Wade, PhD is an Associate Professor at Tulane University. She is the author of American Hookup, a book about college sexual culture; a textbook about gender; and a forthcoming introductory text: Terrible Magnificent Sociology. You can follow her on Twitter and Instagram.
PART ONE:

Drinking lowers your GPA. So do smoking, spending time on the computer, and probably other forms of moral dissolution. That’s the conclusion of a survey of 10,000 students in Minnesota.

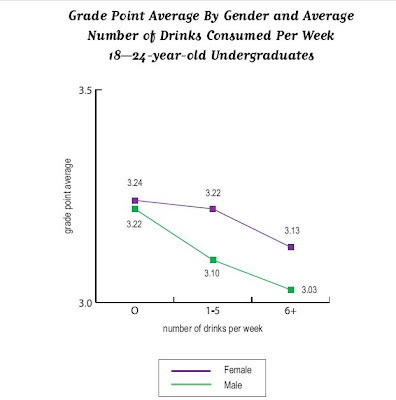
Inside Higher Ed reported it, as did the Minnesota press with titles like “Bad Habits = Bad Grades.” Chris Uggen reprints graphs of some of the “more dramatic results” (that’s the report’s phrase, not Chris’s). Here’s a graph of the effects of the demon rum.

Pretty impressive . . . if you don’t look too closely. But note: the range of the y-axis is from 3.0 to 3.5.

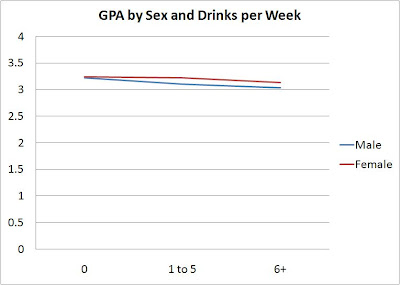
I’ve blogged before about “gee whiz” graphs , and I guess I’ll keep doing so as long as people keep using them. Here are the same numbers, but the graph below scales them on the traditional GPA scale of 0 to 4.0.

The difference is real – the teetotalers have a B+ average, heaviest drinkers a B. But is it dramatic?

I also would like finer distinctions in the independent variable, but maybe that’s because my glass of wine with dinner each night, six or seven a week, puts me in the top category with the big boozers. I suspect that the big differences are not between the one-drink-a-day students and the teetotalers but between the really heavy drinkers – the ones who have six drinks or more in a sitting, not in a week– and everyone else.

—————————-

PART TWO:

Some time ago, the comments on a post here brought up the topic of the “gee whiz graph.” Recently, thanks to a lead from Andrew Gelman, I’ve found another good example in a recent paper.

The authors, Leif Nelson and Joseph Simmons, have been looking at the influence of initials. Their ideas seem silly at first glance (batters whose names begin with K are more likely to strike out), like those other name studies that claim people named Dennis are more likely to become dentists while those named Lawrence or Laura are more likely to become lawyers

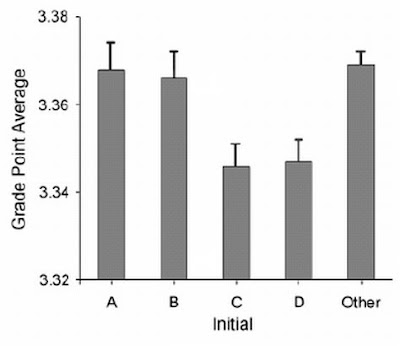
But Nelson and Simmons have the data. Here’s their graph showing that students whose last names begin with C and D get lower grades than do students whose names begin with A and B.

The graph shows an impressive difference, certainly one that warrants Nelson and Simmon’s explanation:

Despite the pervasive desire to achieve high grades, students with the initial C or D, presumably because of a fondness for these letters, were slightly less successful at achieving their conscious academic goals than were students with other initials.

Notice that “slightly.” To find out how slight, you have to take a second look at the numbers on the axis of that gee-whiz graph. The Nelson-Simmons paper doesn’t give the actual means, but from the graph it looks as though he A students’ mean is not quite 3.37. The D students average between 3.34 and 3.35, closer to the latter. But even if the means were, respectively, 3.37 and 3.34, that’s a difference of a whopping 0.03 GPA points.

When you put the numbers on a GPA axis that goes from 0 to 4.0, the differences look like this.

According to Nelson and Simmons, the AB / CD difference was significant (F = 4.55, p < .001). But as I remind students, in the language of statistics, a significant difference is not the same as a meaningful difference.

Breastfeeding is widely believed to carry significant health advantages for infants and the American Academy of Pediatrics (AAP) would like to see all mothers breastfeed their children for at least 12 months, with no supplemental food for the first six.

Breastfeeding, however, is a big job.  Even if a newborn takes to breastfeeding without any problems (some mothers struggle mightily with less-than-cooperative infants), mothers must feed their children around the clock (they now recommend every two hours, 24-hours a day for newborns).  If it takes a half hour to settle the baby down and fill it up, you’ve got an hour and a half before the next feeding time.

Mothers who have the privilege to stay home with their babies — for three, six, or even twelve months — then, are going to find it much easier to follow the AAP guidelines.  For mothers who return to work, those who work in flexible positions that award some degree of autonomy and respect will also be more likely to continue breastfeeding.   In other words, a lawyer with a private office and a work schedule under her own control can stop several times a day and express milk to bring home to her child; in contrast, a woman working the cash register at McDonald’s with a boss hovering over her doesn’t have the same autonomy or privacy and may be forced to give up breastfeeding.

It shouldn’t be surprising, then, that breastfeeding rates are higher among more educated women and White and Asian women.  Both of these variables tend to correlate with class privilege:

There are some interesting things, however, that don’t correlate with this class thesis.  First Hispanic women are more likely to breastfeed than White women and people with less than a high school education are more likely to breastfeed, especially at six and 12 months, than people with a high school education.

I can think of some reasons why… I’ll let you discuss it in the comments.

Borrowed from Philip Cohen’s Family Inequality Blog.  For more data on rates of breastfeeding, including U.S. state comparisons and changes in rates over time, see here.

Lisa Wade, PhD is an Associate Professor at Tulane University. She is the author of American Hookup, a book about college sexual culture; a textbook about gender; and a forthcoming introductory text: Terrible Magnificent Sociology. You can follow her on Twitter and Instagram.
Amanda brought our attention to a photo project by L. Weingarten called “A Series of Questions.” The ongoing project is designed to draw our attention to how the kinds of questions we ask transgender people makes them feel like inexplicable Others. From a description of the project:

The subjects, self-identified people of transgender, transsexual, genderqueer, gender-variant, or gender non-conforming experience, hold signs depicting questions that each has had posed to them personally — some by strangers, others by loved ones, friends, or colleagues. Presented on white wooden boards, the questions are turned on the viewer, shifting the dynamics under which they were originally asked, and prompting the viewer to cast a reflective, self-critical eye upon him or herself, revealing how invasive this frame of reference can be.

In other words, these questions get asked not only because transgender people break the rules, they get asked because the rest of us can be so inflexible, utterly confounded when other around us challenge our assumptions about the world.


Lisa Wade, PhD is an Associate Professor at Tulane University. She is the author of American Hookup, a book about college sexual culture; a textbook about gender; and a forthcoming introductory text: Terrible Magnificent Sociology. You can follow her on Twitter and Instagram.
Cosmopolitan Magazine has been around since 1886 so it has seen quite a great deal of change over that time. The evolution of The Cosmopolitan Magazine into what is known today as Cosmo shows just how dramatic that change has been. In its early days, The Cosmopolitan was billed as a woman’s fashion magazine that included articles on the home, family, and cooking, but also included articles like “Some Examples of Recent Art” and “The Progress of Science.”


Later it became more focused as a showcase for new fiction and published works by authors like Upton Sinclair, Sinclair Lewis, Kurt Vonnegut, Willa Cather, and H. G. Wells. Typically, each issue would have five to eight short-stories, a full novelette, a full short novel, and some article on fashion and health. During this time, the cover art was almost exclusively illustrated — even when the covers featured celebrities.

With the introduction of television, there was a drastic decline in the demand for fiction-based magazines. In response to the waning sales there was a radical shift in the direction of Cosmopolitan. In the mid sixties, Helen Gurley Brown stepped in as editor in chief. She brought with her the message of sexual freedom for single women, and started replacing the cover illustrations with photos of young models in minimal clothing.  Sales increased as a result.

Since then the magazine has become more sexually centered. It still features many articles on having pleasurable sex and maintain fulfilling relationships. There is a much greater emphasis on how women can make themselves more desirable to men. One look at the website reveals the tone of the magazine. These are the first three articles listed:

“4 Traits Men Find Irresistible”
“What Men Secretly Think of your Hair and Makeup”
“What You Should Do if He Cheats”

The late Kurt Vonnegut (who had multiple short stories featured in Cosmopolitan in the fifties) had this to say about the magazine: “One monthly that bought several of my stories, Cosmopolitan, now survives as a harrowingly explicit sex manual.”  Indeed, browsing through the cover art of the past few years gives one the impression that there are an infinite number of sex positions. It is hard to feel sexually liberated while reading a magazine that talks about the vagina (or Hoo-Ha) like it’s something you can buy at a pet store. They have also been criticized for perpetuating a nearly impossible standard of beauty and for retouching models to make them appear thinner.  Today Cosmopolitan retains almost no reminants of its origins. It is fascinating to see how it has shifted with the culture and how our culture has changed because of it.

Sources: herehere, here, here, here, here, and here.

—————————–

Lauren McGuire is a SocImages intern and an assistant to a disability activist.   She recently launched her own blog, The Fatal Foxtrot, that is focused on the awkward passage into adulthood.

If you would like to write a post for Sociological Images, please see our Guidelines for Guest Bloggers.

Caesarean sections — or C-sections, a surgery that involves making incisions through a woman’s abdomen and uterus to deliver her baby — have been on the rise since the mid-1990s.  Last month a New York Times story reported that 2007 saw the highest rate of Caesarean sections ever, 32 percent:

It is primarily non-medical issues that are driving the increase.  Many C-sections are performed because physicians fear lawsuits.  In a survey of obstetricians, 29 percent admitted to performing C-sections for this reason.

In other cases, mothers request that their labor be induced.  She may have a grandmother in town or a military husband about to be deployed and she wants to have the child while her family can be present.  Induced labor often fails and, so, C-sections are required.  More insidiously (and not mentioned in the story), epidurals also tend to slow down labor and require induction.  So the high rate of epidural use may also be contributing to the rise in C-sections.

And, C-sections beget C-sections.  Fewer and fewer women who have had a previous C-section are being allowed to attempt a vaginal birth.  “Fewer than 10 percent of women who had Caesareans now have vaginal births, compared with 28.3 percent in 1996.”

Rates of C-section in the U.S. are higher than in most industrialized countries but lower than in some developing countries.  “…rates have soared to 40 percent in some developing countries in Latin America, and the rates in Puerto Rico and China are approaching 50 percent.”

And rates in the U.S. states vary by 16 percentage points.  “The highest rates of Caesarean births were in New Jersey (38.3 percent) and Florida (37.2 percent), and the lowest were in Utah (22.2 percent) and Alaska (22.6 percent).”

There was no discussion about why the rates among states in the U.S. would be so variable.  Thoughts?

Lisa Wade, PhD is an Associate Professor at Tulane University. She is the author of American Hookup, a book about college sexual culture; a textbook about gender; and a forthcoming introductory text: Terrible Magnificent Sociology. You can follow her on Twitter and Instagram.