An Ounce of Precaution
Studies conducted in small communities around the globe often conclude elevated rates of cancer and other diseases are “not substantiated.” When residents in communities like these learn about their high rates of cancer, common sense tells them something’s wrong-it doesn’t take an epidemiologist to draw connections between their health and the pollution in their midst. But when scientists tell them the difference is “not substantiated,” “not scientifically verifiable” or “not statistically significant,” it looks to residents like science is being used as some trickster’s sleight of hand to hide what everyone can plainly see. As more communities have questions about the health consequences of past and present pollution in their midst, it’s more important than ever to understand the science behind the terminology. With this knowledge in hand, we can ask whether rates like these can be significant without being statistically significant and whether a precautionary approach might go a long way toward protecting community health.
further reading online
About this Issue’s Cover
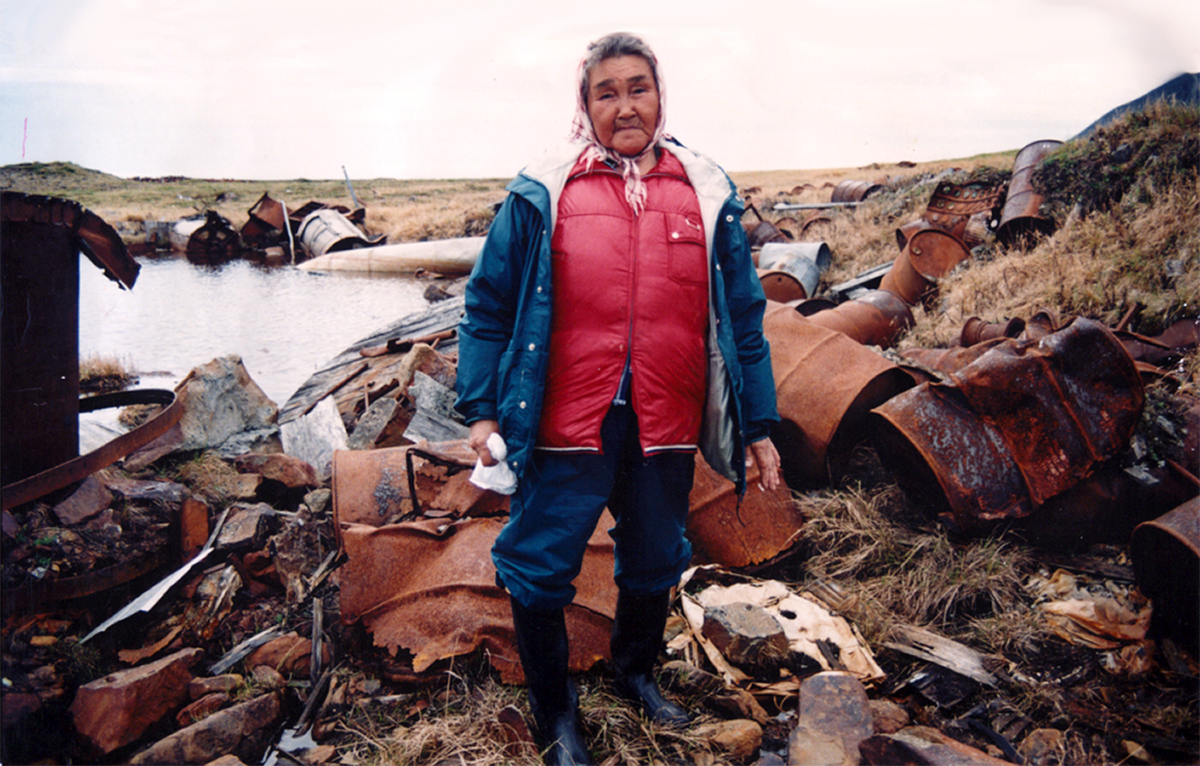
Photo courtesy Alaska Community Action on Toxics
Alaska native elder and former village health aide Annie Alowa, now deceased, stands amid military debris at the formerly used defense site at Northeast Cape on St. Lawrence Island. Not unlike Point Hope, St. Lawrence Island is yet another American community faced with pollution and contamination from past military and industrial activities. Alowa’s relentless calls for attention to the high rates of cancer in her community resulted in a research project being conducted in two communities on the island, in collaboration with Alaska Community Action on Toxics.
People and Places
In An Ounce of Precaution, Nelta Edwards highlights three communities that have suffered as a result of environmental toxins. Click on the links below to learn more about Point Hope, Alaska, Bell County, Kentucky, and Salisbury, North Carolina.
- Alaska Native Cancer epidemiology in the Arctic: This Public Health article discusses elevated cancer rates throughout Alaska, with reference to Point Hope.
- The death and life of Yellow Creek: “In the mountains and hollows of Kentucky coal country, one group of citizens learns what it takes to protect their lives and their land.”
- Connecting the dots, doctor sees pattern of death, illness: Dr. Weisler talks about his findings in the North Carolina newspaper, News & Observer.
- To learn more about elder Annie Alowa, the Yu’pik elder featured on this issue’s cover, through the Alaska Community Action on Toxics website, watch the full length documentary, I Will Fight Until I Melt.
Sociologists studying environmental harm and degradation
Nelta Edwards isn’t the only sociologist concerned about the quantification of harm. The following references are a few additional resources on this topic.
Theo Colborn. “A Case for Revisiting the Safety of Pesticides: A Closer Look at Neurodevelopment,” Environmental Health Perspectives, 2006.
Adam M. Finkel. “Is risk assessment really too conservative? Revising the revisionists,” Columbia Journal of Environmental Law, 1989.
Sara Grineski, Jennie Kronenfeld, and Bob Bolin. “In The Face of Uncertainty: Community Health, Environmental Hazards and Statistical Significance,” (Paper presented at the annual meeting of the American Sociological Association, 2003).
Sandra Steingraber. Living Downstream (Addison-Wesley Publishing, 1997). A discussion of the importance of small doses and multiple exposures.
Peter Waldman. “Common Industrial Chemicals In Tiny Doses Raise Health Issue,” Wall Street Journal, 2005.
Steve Wing. “Limit of Epidemiology,” Medicine and Global Survival, 1994.
How to Calculate the Numbers in Table 2
For those interested in taking a closer look at Edwards’ data, here is a step-by-step explanation of the data in Table 2:
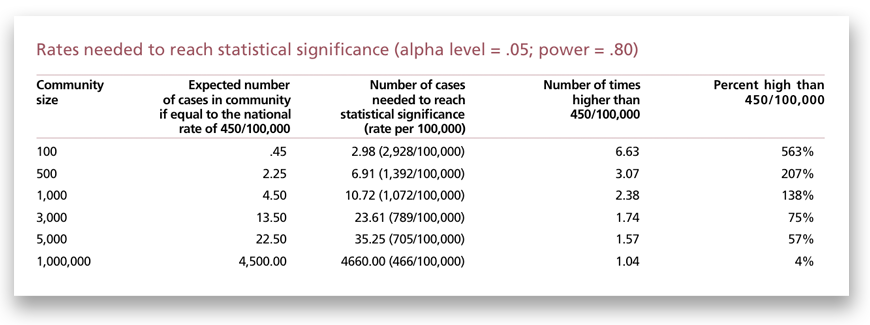
(Click image to view a larger version.)
- To calculate values for column B divide 450 by 100,000 (450/100,000 = .0045). This is the proportion. Multiply this by the size of the community, (e.g., 100 x .0045 = .45).
- The number of cases needed to reach statistical significance in column C was calculated in a software program called Minitab, which offers a 30-day free trial. To calculate the rates, open Minitab and
- At the top of the page click on the “stat” tab,
- go all the way to the bottom and click on “power and sample size,”
- Click on [1P] “1 proportion . . .” because we want to do a one sample Z test for the difference in proportions (the difference between the local and the national proportion),
- In the box called “Power and Sample Size for 1 Proportion,” type in the sample size for which you want an estimate (e.g., 100, 500, 1000, etc.), leave the “alternate values of p” blank because this is the proportion we want the program to calculate, type in the power value (.80) and the hypothesized p value of .0045 (converting the rate of 450/100,000 to a proportion),
- Click “Options,” a window will open and under “Alternative Hypothesis” click on the circle next to “greater than” because you think the local rate is greater than the national rate (a one tailed-test), leave the significance level at .05, click OK,
- Click on the “Graphs” box and make sure “display power curve” is clicked if you want to see the power curve, click OK,
- Click OK again. The “alternative proportion” is the proportion needed to get statistical significance.
- To calculate the rate in Column C, multiply the “alternative proportion” by the community size (e.g., .0298256 x 100 = 2.98256).
- To calculate the values in column D, divide the value in Column C by the value in Column B (e.g., for a community of 100: 2.98/.45 = 6.63).
- To calculate the values in column E, subtract the value in Column B from Column C. Divide this number by the value in Column B. Multiply this number by 100 (e.g. for a community of 100: [(2.98-.45)/.45] x 100 = 562.22)

Comments 1
nelta
May 20, 2008Nelta would like to thank Penny Cordes, Mary Ellen Gordian, Karen Southwood, Melissa Toffolon-Weiss, the editors, and the anonymous reviewers for their helpful advice on earlier drafts of this paper. Special thanks to Linda LD Smith for her enthusiasm and excellent advice and to Karl Bryant for his constant encouragement.