
From Flickr CC // flic.kr/p/dksV5a
Who has how many sexual partners?
Inequality in the distribution of heterosexual partnerships
First-year college men complain that they can’t score with girls because the upper classmen “get” all of them. Older women going online to date face a fierce double-standard of aging; the typical man of any age wants young women. In societies with polygyny, some men have two or more wives, while the others have no wives and sometimes no sex partners as a result. These examples remind us that access to sex can be unequally distributed.
Social scientists often use the Gini index to study how unequally income is distributed, for example across households. To contribute to studying sex with an inequality focus, we applied the Gini index to heterosexual partnerships. As far as we know, this is the first such application of the Gini to sex.
What we did
We used data from the National Survey of Family Growth surveys collected between 2002 and 2013. We chose (non-Hispanic) White, (non-Hispanic) Black, and Hispanic individuals between 18 and 35 years of age. Respondents were asked their number of male sexual partners and their number of female sexual partners in the last year. Respondents were asked this question if they reported on a previous question that they had ever had vaginal, oral, or anal sex with an other-sex sexual partner. We removed individuals from the sample who identified as gay or lesbian if they reported that they had no other-sex sexual partners in the last 12 months. We also removed individuals of any sexual orientation from the sample if they reported that they had never had an other-sex sexual partner in their life.
We divided respondents into different groups, defined by their gender (male or female), race/ethnicity (White, Black, Hispanic), and union status (single versus married or cohabiting). We excluded other racial/ethnic groups because the groups were too small for analysis.
For each group we calculated two things: 1) what percent of people in the group had 0, 1, 2, 3, and 4 or more sexual partners in the last year, and 2) the Gini coefficient. To facilitate compact presentation, our graphs of what percent of members of a group had various numbers of partners combine those with four or more in a single category. However, the Gini coefficient uses the detailed data on exactly how many partners each person reported.
To calculate the Gini coefficient for each group we treated the number of partners of a given sex people in the group had in the last year just like those studying income inequality treat the number of dollars of income a family had in the last year. The formula and an explanation of the Gini coefficient applied to income can be found at this link.
The smaller the Gini coefficient, the more equal the distribution of partners is. The Gini coefficient is 0 if the resource is absolutely equally distributed. In the case of income, this would mean that every household had exactly the same income. In the case of sexual partners, it would mean that all members of the group had the same number of partners in the last year. At the other end of the scale, a Gini coefficient of 1 means the maximum inequality. If, for example, among men in one group, one man had 40 partners and most others had 0, the Gini coefficient would be close to 1. Detailed tables of our findings are available here.
Gender differences in the distribution of other-sex partners
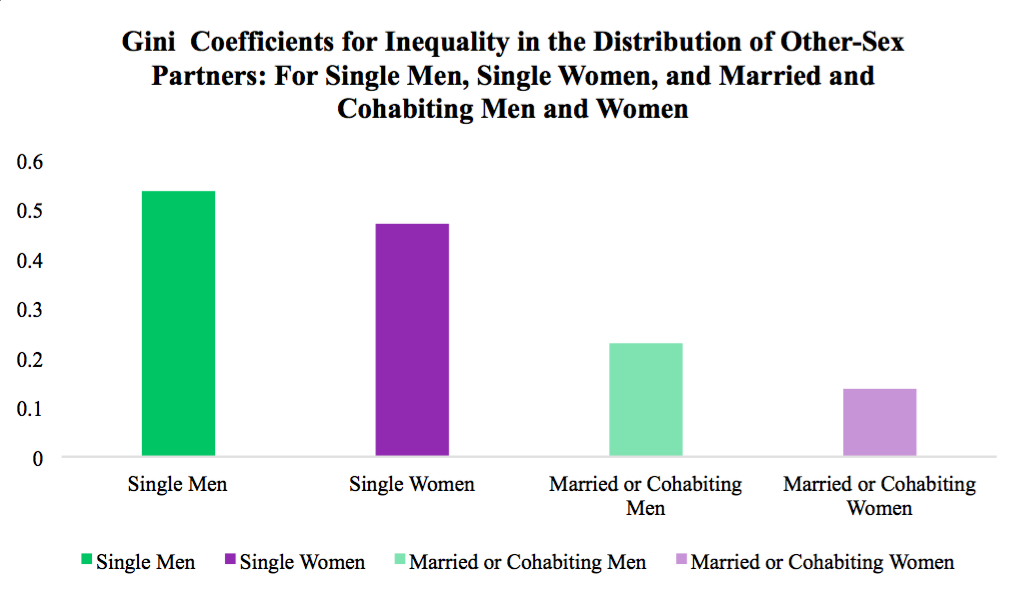
First we compare single men with single women. (“Single” means not currently married or cohabiting. “Cohabiting” means not married, but living together.) The graph below shows that single men have a higher Gini coefficient (.536) than single women (.470). Thus, female sexual partners are more unequally distributed among single men than male sexual partners are among single women. When we did the same for married or cohabiting men and women, we also found that sexual partnerships with women were more unequally distributed among men than partnerships with men are distributed among women, .229 for men versus .137 for women. The graph below also shows that, for both men and women, partners are more unequally distributed among singles than among those married or cohabiting.
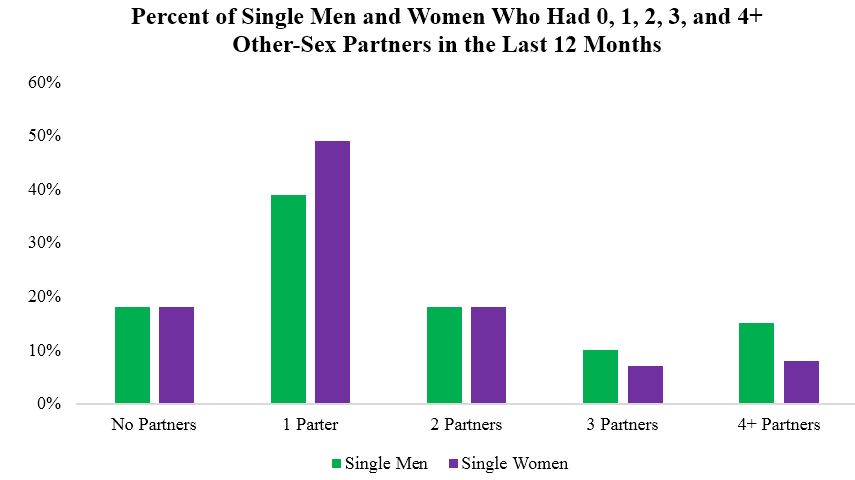
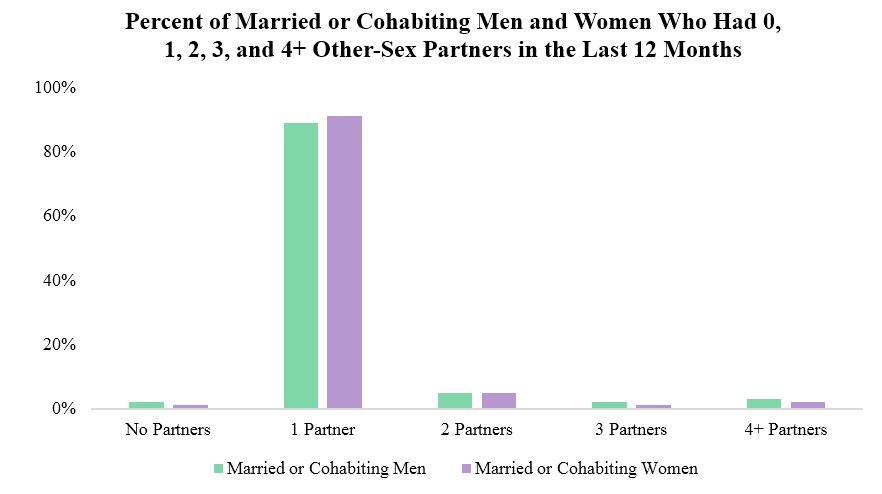
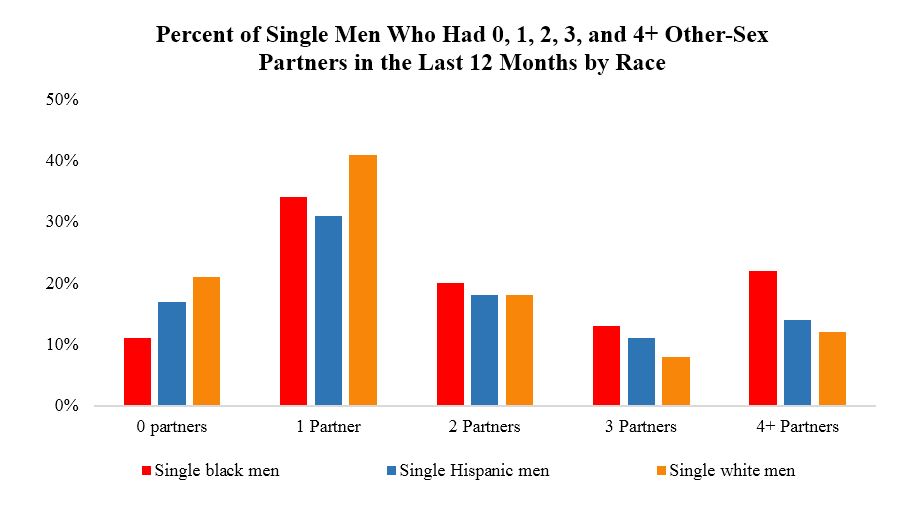
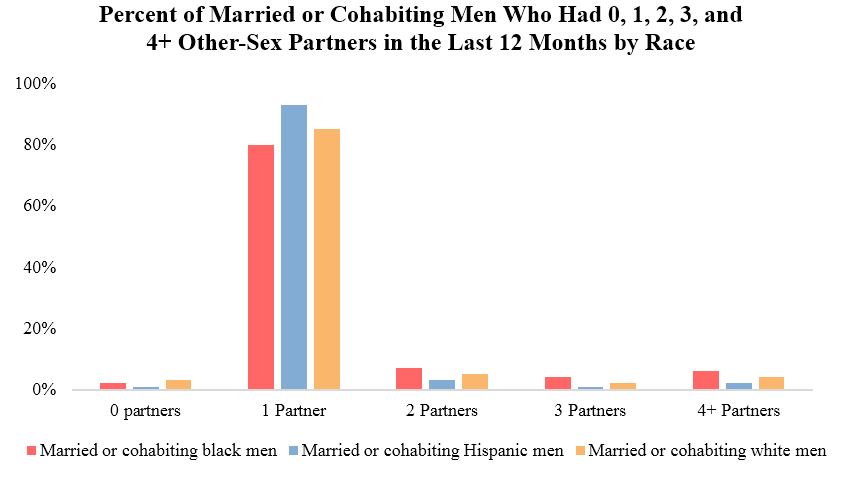
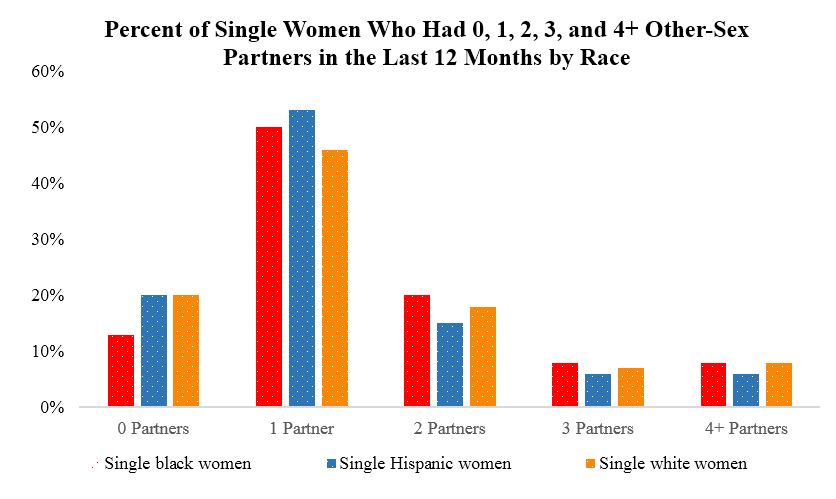
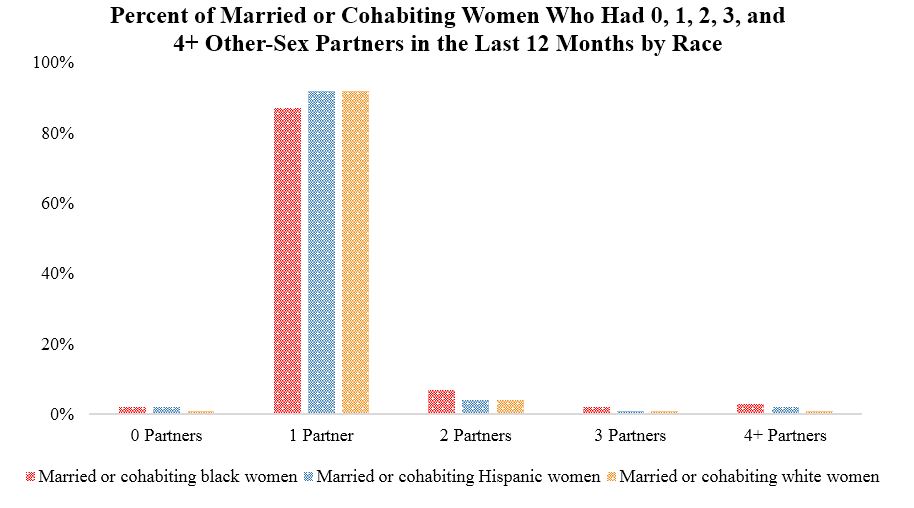
To help us interpret these differences, the two graphs below show what percent of men and women had how many partners last year, separately for singles and those who are married or cohabiting.
The greater inequality for singles than those married or cohabiting reflects the equalizing effect of a situation in which the vast majority of people have the same number of partners—exactly one. Among those married or cohabiting, 89% of the men and 91% of the women report just one partner last year. Technically speaking, what makes the Gini coefficient low is not that the most common number is 1, but rather that such a high proportion of people are at the most popular number, with few people at a much higher or lower number.
The gender difference in monogamy among singles appears to explain why female partners were more unequally distributed among men than male partners were among women. That is, while 49% of single women had only one partner, only 39% of single men did so. A higher percent of men than women were in the 2, 3, and 4+ categories. This greater dispersion of men farther away from the modal category of 1 partner contributes to their higher Gini coefficient.
The gender difference among those married and cohabiting is more mysterious, as the distribution of number of partners is very similar between the two groups, as you can see in the second graph below. It comes from slightly fewer men than women having the modal number—one partner, and slightly more men than women being in the extreme categories of no partners or more than 4.
Race Differences in the Distribution of Men’s and Women’s Other-Sex Partners
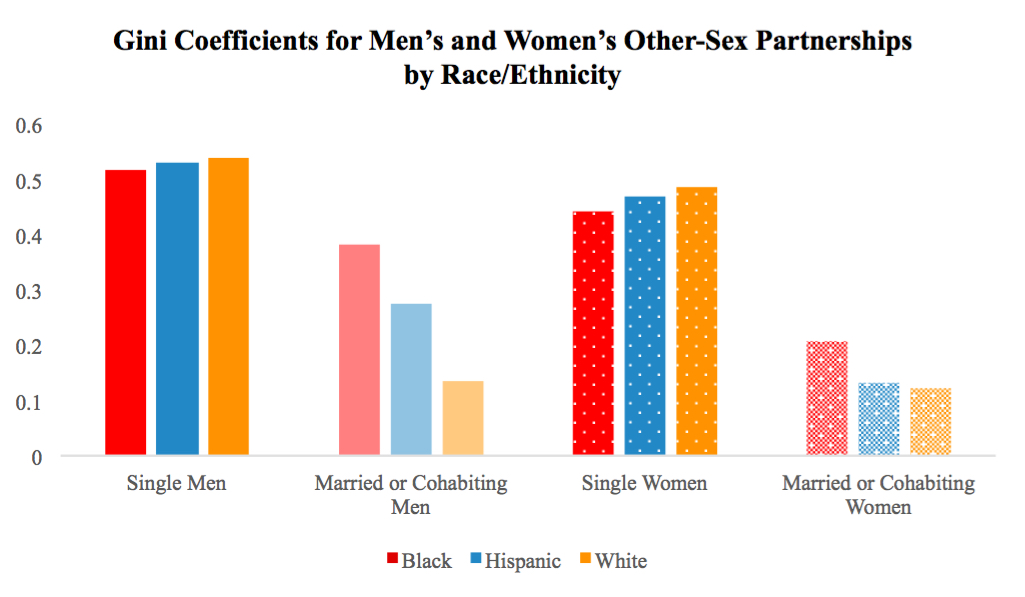
We also find that race/ethnic groups differ in their levels of within-group inequality in how partners are distributed. The graph below gives the Gini coefficients for the groups we examined above, but divides each into Blacks, Hispanics, and Whites.
For men, the graph shows that, among singles as well as those who are married or cohabiting, the distribution of female partners is most unequal among Black men, with women distributed most equally among White men. Hispanics are intermediate. Why? While the modal category is 1 partner for all groups, the dispersion of a larger minority out to the extremes of 3 and 4+ partners is greatest for Black men and least for White men. This could reflect lower levels of monogamy among Black men within relationships. Alternatively, it could reflect that fact that more of the married/cohabiting group are cohabitors among Blacks than Whites, and cohabiting relationships have less clear norms of monogamy in all groups. Another possible explanation of more men with more than one partner among Blacks is that the lower rates of coresidential unions (marriage or cohabitation) among Blacks means that it is more likely that, within any year preceding a survey, a Black man in a union at survey was not in it the entire previous year; all groups are more likely to have had more than one partner when not in a union.
By contrast, male partners are distributed among single women with about the same level of inequality for the three race/ethnic groups, and the three groups have similar distributions of number of partners. However, among cohabiting and married women, Black women have the most unequal distribution of partners, which may be because not as many are in the modal category of only one partner. As mentioned above for men, this could be because Black women’s relationships are less monogamous, or because more of Black women’s coresidential unions were cohabitations rather than marriages or did not exist during all of the preceding year.
Conclusion
Groups defined by gender, race, and union status differ in how unequally sexual partnerships with members of the other sex are distributed among members of the group. We found that partnerships are distributed more equally among those who are married or cohabiting because nearly everyone has the same number of partners in a year—one. Partners are most unequally distributed among Blacks and less so among Whites, with Hispanics intermediate. This is especially true among men. Finally, female partners are distributed more unequally among men than are male partners among women, largely because a higher proportion of women have one partner. This post was limited to heterosexual partnerships; our next post will consider groups defined by sexual orientation.
Partners of the other sex are more equally distributed among members of a group when group members are more monogamous. However, it isn’t monogamy in and of itself that causes equality, but the high percent of people clustered at or very closely around any one number of partners. However, given that one partner is the modal category for all groups, any group that has more members with higher numbers shows more inequality in partner distribution.

Comments 7
Graham Peterson
August 27, 2016Was this post intended to be entirely descriptive? I don't understand why we would construct a gini or showing the distribution of sexual partners if there is no contested story about power, mating markets, etc. to motivate the exercise. There are so many rich questions that these data could speak to. Are black and brown people "hyper sexual" relative to whites? Do behavioral data actually support that society condones and encourages masculine philandering and feminine chastity? Lots of missed opportunities here.
Austin
November 29, 2016Correct me if I'm misunderstanding, but I believe you either are innacurrately showing the data for married men or inaccurately calculating the Gini coefficient. Let me explain.
You say "Partners are most unequally distributed among Blacks and less so among Whites, with Hispanics intermediate. This is especially true among men."
The problem is your data for married Hispanic men does not show this, it shows that married hispanic men have a higher percentage having 1 partner, and lower percentages for 0, 2, 3, and 4+ partners. Thus the data for hispanic married men is LESS unequally distributed than blacks and whites, so its Gini coefficient should be smaller.
Except you show the gini coefficient for married hispanic men as being HIGHER than that for white married men.
Ww
April 29, 2017What about asians?
Terry Dyroff
May 2, 2017Seems to me that you must get a number for those in a committed relationship that are not cohabiting for this to be very accurate. I suspect that many in the "1 Partner" category were in a committed relationship and a fair number in the other categories were in a committed relationship for part of the year. Any estimates or other research that would shed some light on this number?
emsdmssds
October 19, 2019Thank you so much for this. I was https://tracktrace.one/usps/ into this issue and tired to tinker around to check if its possible but couldnt get it done. Now that i have seen the way you did it, thanks guys
with
regards
paper io 2
July 13, 2020Your article content is being a lot of people interested, I am very impressed with your post. I hope to receive more great posts.
Bryan Carter
April 16, 2021I am impressed by your math skills and professional wording. Next time consider a presentation that is understandable by your audience. Bryan Carter, P.E..