
Image by Jimmy from Flickr Creative Commons https://flic.kr/p/7XHb3Y
Who thinks sex with same-sex partners is “wrong”?
Last year’s US Supreme Court ruling in US v. Windsor, interpreting the US Constitution to require that states allow same-sex marriage, was the dramatic culmination of years of struggle. Pollsters have documented large recent shifts toward more favorable attitudes about same-sex marriage. We wanted to examine public opinion on a more basic question: What do Americans think about sex between partners of the same sex? Fortunately, the General Social Survey (GSS) has asked the same question about this for decades, allowing us to examine trends and group differences.
In the graphs below, there are two main messages:
- Since 1990 opinions in all groups are getting more accepting of sex between same-sex partners, and
- The country is divided by gender, education, and race on this issue.
What we did
We used GSS data from 1974 to 2014. The question was worded this way: “What about sexual relations between two adults of the same sex—do you think it is always wrong, almost always wrong, wrong only sometimes, or not wrong at all?” The wording of the question seems odd today; it was written in an era where there was a general presumption that most people found such behavior “bad.” Nonetheless, the consistent wording allows us to discern trends. The two extreme categories were by far the most popular, so we divided responses into the first two (always or almost always wrong) and the second two (wrong only sometimes or not wrong at all) which we call “not wrong.” (For more on what we did to get the graphs, see “Technical details” at the end of this post.)
Attitudes have gotten steadily more accepting since 1990
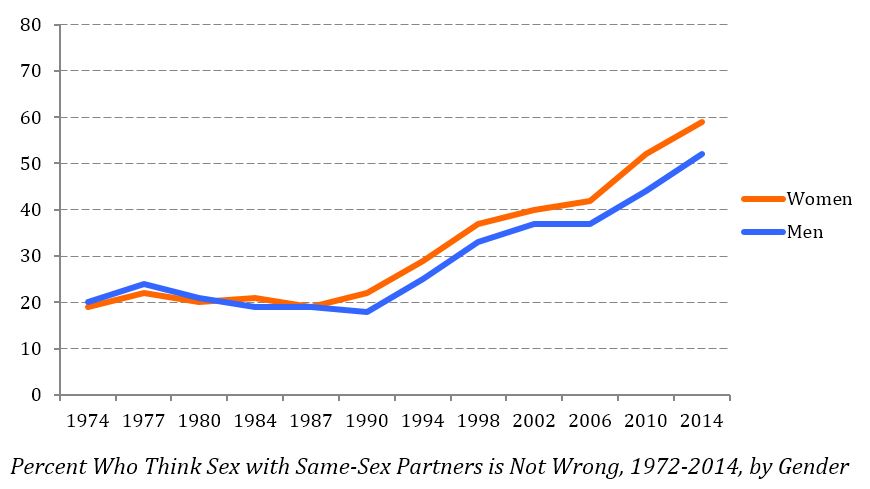
In the first graph below you see attitudes across the years, separately for men and women. There was no change to speak of in the 1970s and 1980s, and it was a time when only 20% of either women or men thought that sex with same-sex partners was not wrong. Put another way, 80% thought it was always or almost always wrong. About 1990 opinions started getting more accepting and they have moved strongly in that direction ever since. By 2014, fewer than half of either men or women saw sex with same-sex partners as wrong.
Women are more accepting than men
The gender gap, with women more accepting than men, emerged just at as opinions started getting more accepting and a clear gender gap still remains—a gap of about 7 percentage points. Nonetheless, both men and women are moving in a more accepting direction.
These data don’t show us why men have more heterosexist attitudes than women. Our speculation is that, because many see sex with same-sex partners as violating gender norms, and there is more strict informal “policing” of men’s than women’s gender conformity, men are under more peer pressure to condemn homosexuality so as to make sure that they are not seen as gay. They may internalize the negative view.
The liberalizing force of education
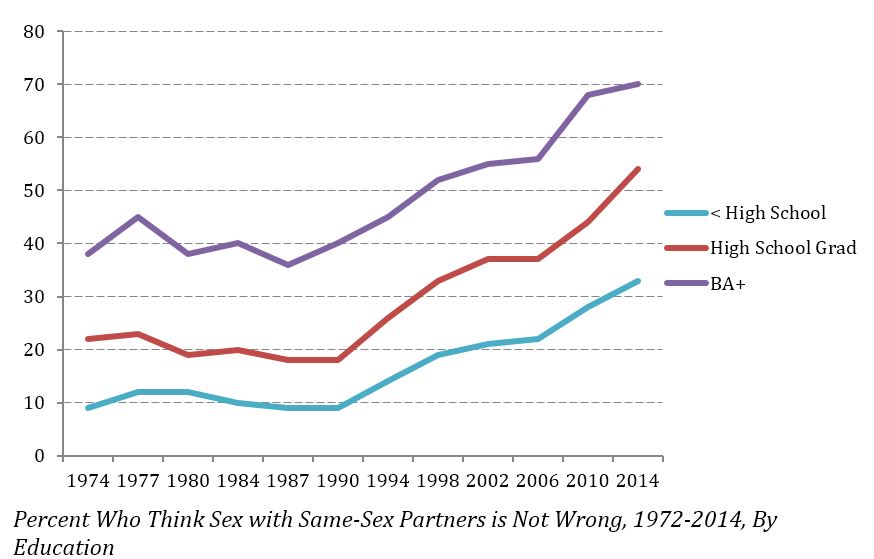
There are large differences by education in whether people have accepting attitudes toward sex with same-sex partners, as the next graph shows. These differences have been present at least since the 1970s, and are just as large now as then. In this sense, education is different from gender or race (below). In 2014, 70% of college graduates saw sex with same-sex partners not to be wrong, while only 33% of those without a high school degree held that relatively accepting view. Those with just a high school degree were in between. Every education group liberalized their opinion after 1990. These data don’t show us why education has a liberalizing effect. It could be because education attunes people to more complex arguments, and leads them to question traditional rigid thinking about what is good and bad. Education has been found to increase support for many civil liberties, such as for the rights of those with unpopular views to give speeches, have their books in public libraries or work as teachers.
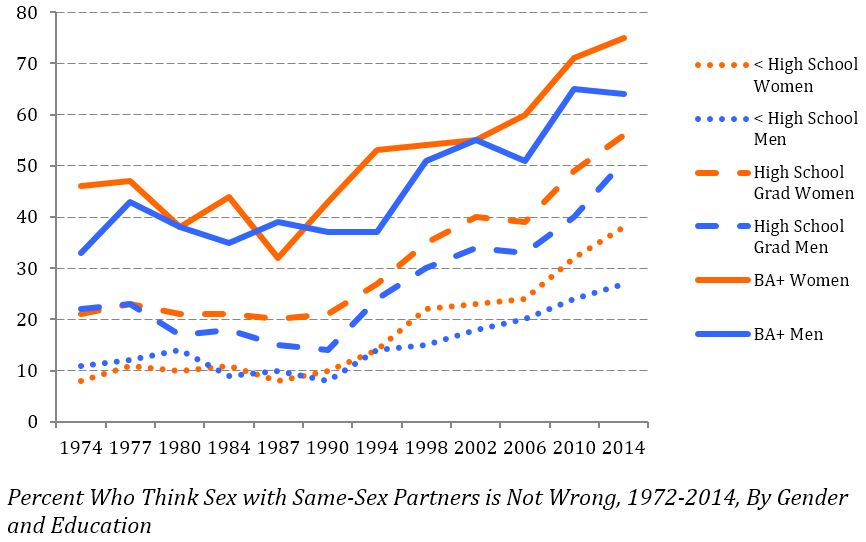
The graph below shows that, at least since 1990, when the overall gender difference emerged, there is a gender gap within each education group. Also, there are educational differences of the same character among both men and women.
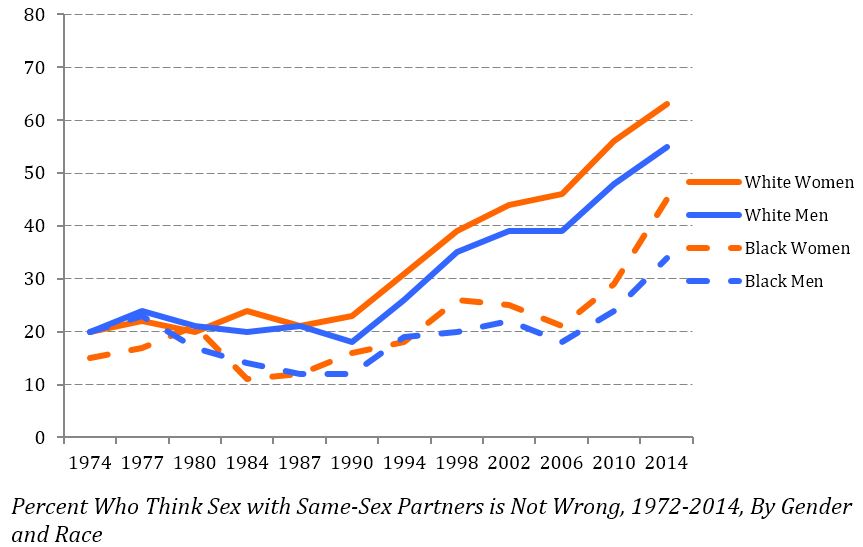
Race differences in views
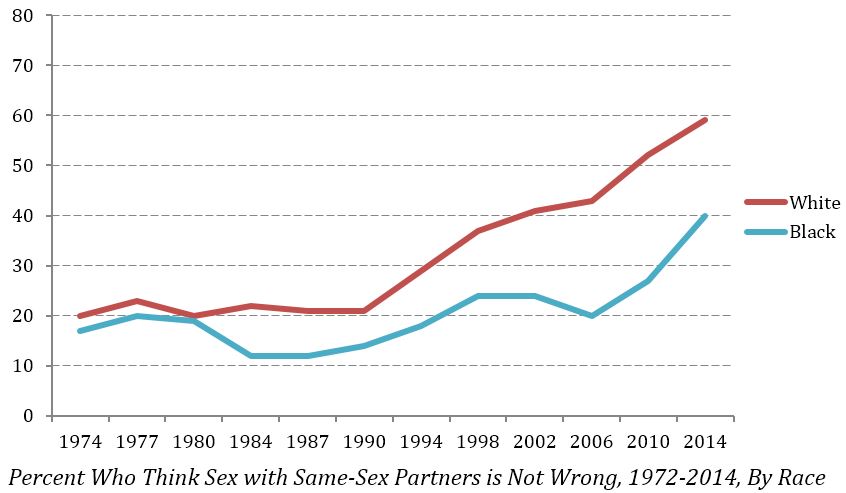
In the 1970s, Blacks and Whites differed only slightly. A little less than 20% of Blacks thought sex with same-sex partners was not wrong, and slightly more than 20% of Whites thought this. After 1980 the race gap emerged and has been 10-20 percentage points since. Although Blacks are more critical of same-sex relations than Whites, their views, like those of Whites, have gotten more tolerant since 1990. As both groups get more tolerant, the race gap like the gender gap, shows no tendency toward convergence.
These data don’t show us why Blacks are more likely than Whites to think same-sex sex is wrong, but as with gender and education we provide our speculative hypotheses. Some, but not most, of it is explained by the fact that, on average, Blacks have less education, and as we saw above education seems to liberalize attitudes on this subject. (Education is not controlled in the graph below, but the gap is only a bit smaller if it is controlled.) Another possible explanation is that Blacks are more likely than Whites to belong to conservative religious denominations; conservative religious groups often teach that homosexuality is wrong, while some liberal Protestant denominations ordain gay or lesbian clergy and perform same-sex marriages. There is another possibility, that the history of racism has entailed Whites seeing Blacks as hypersexual—regardless of their actual behavior. As a response to this, Blacks may be particularly likely to dissociate themselves from anything involving sex that they see as socially stigmatizing.
Race and gender together
The next graph shows that the gender differences we saw in our first graph are present within Blacks, and within Whites. At least this is true after 1990 when the clear gender differences emerged. The graph also shows that the race differences are present within men and within women, at least after 1980 when the race differences first emerged. In statistical terms, there is little interaction between sex and race—that is, the sex differences are of about the same size within both Blacks and Whites, and the race differences are of approximately the same size within both men and women. The graph also shows that attitudes have liberalized in all four groups.
Liberalization with enduring group differences
Overall, picture we get is one of increasingly accepting attitudes toward those who have sex with same-sex partners. This probably implies more accepting attitudes toward lesbian, bisexual, or gay individuals and their relationships. Yet this liberalizing trend did not start until about 1990. The date when the liberalization started makes us question whether it was part and parcel of the sexual revolution of the 1960s and 1970s; it started much later.
Americans in all groups we examined are getting more accepting in their attitudes, but there is no convergence between groups. Women are more accepting than men, the well educated more so than the less educated, Whites more so than Blacks, and these gaps show no sign of closing. Finally, race and education gaps in acceptance of same-sex sexual relationships are substantially larger than the gender gap.
Technical details
To create our graphs we first grouped years of the survey. Because the GSS was conducted almost every year from 1972-1994, and then every other year after that, the sample size varies depending on the year of the survey; when the survey was conducted every year, a smaller sample was surveyed than when the survey was conducted every other year. Thus, to smooth the trends, we combined years into 2-3 year increments so that there were on average 4700 respondents sampled in each recoded category. The categories were: 1972-1974; 1975-1977; 1978-1980; 1982-1984; 1985-1987; 1988-1990; 1991-1994; 1996-1998; 2000-2002; 2004-2006; 2008-2010; and 2012-2014.
The lines in the graphs are predicted scores from regressions; a separate regression was run to produce each line shown in each graph, using the margins command in Stata. Thus, a separate logistic regression was run for each group for whom a line is shown (e.g. White men in a graph that divided by race and sex). The regression predicted the respondent answering “not wrong.” Independent variables in the model were indicator variables for the years in the study (grouped as described above), respondent age (18-89), age squared and age cubed. Therefore, each regression is similar to the observed values, except that we are adjusting year trends within group for any changes that occurred in the age distributions of persons in the group the across the years.
We would have liked to examine trends for Hispanics as well as Blacks and Whites. Unfortunately, Hispanic ethnic identity was not measured in the GSS until 2000. Therefore, we could not examine this trend across years. Thus, we limit the analysis to individuals identifying as either White or Black.
For more information on the GSS data, see http://gss.norc.org/.

Comments 3
Deva
January 18, 2016What are the totals for the general population - i.e., not disaggregated?
Paula England
January 31, 2016If you look at the first figure, and mentally make a line that goes midway between the line for men and the line for women, that's what the line for the general population would be (since there are about an equal number of men and women). So it started getting more accepting in about 1990 and has since. Paula England
kelly
May 3, 2020There are so many ways to get the free tiktok fans online at this website for which you can do anything here.